
Mass Violence in North Carolina, 2020-2025
National trends show that mass violence peaked in 2021 but decreased through 20251. To understand how these trends manifest locally, the Criminal Justice Analysis Center analyzed North Carolina incident data. This report examines statewide shootings reported in the National Incident-Based Reporting System, or NIBRS, involving a firearm where four or more victims, excluding the shooter, were injured or killed2. This definition matches the standard definition used by the Gun Violence Archive. This snapshot analyzes the reported data available as of June 2026. It is possible that other mass violence incidents occurred but were not reported in NIBRS at the time of publication.
There were 99 incidents of mass violence in 2020-2025 which included 76 homicides and 392 reported aggravated assault offenses. This resulted in 468 victims of mass violence in North Carolina over the time period.
North Carolina Incidents Over Time
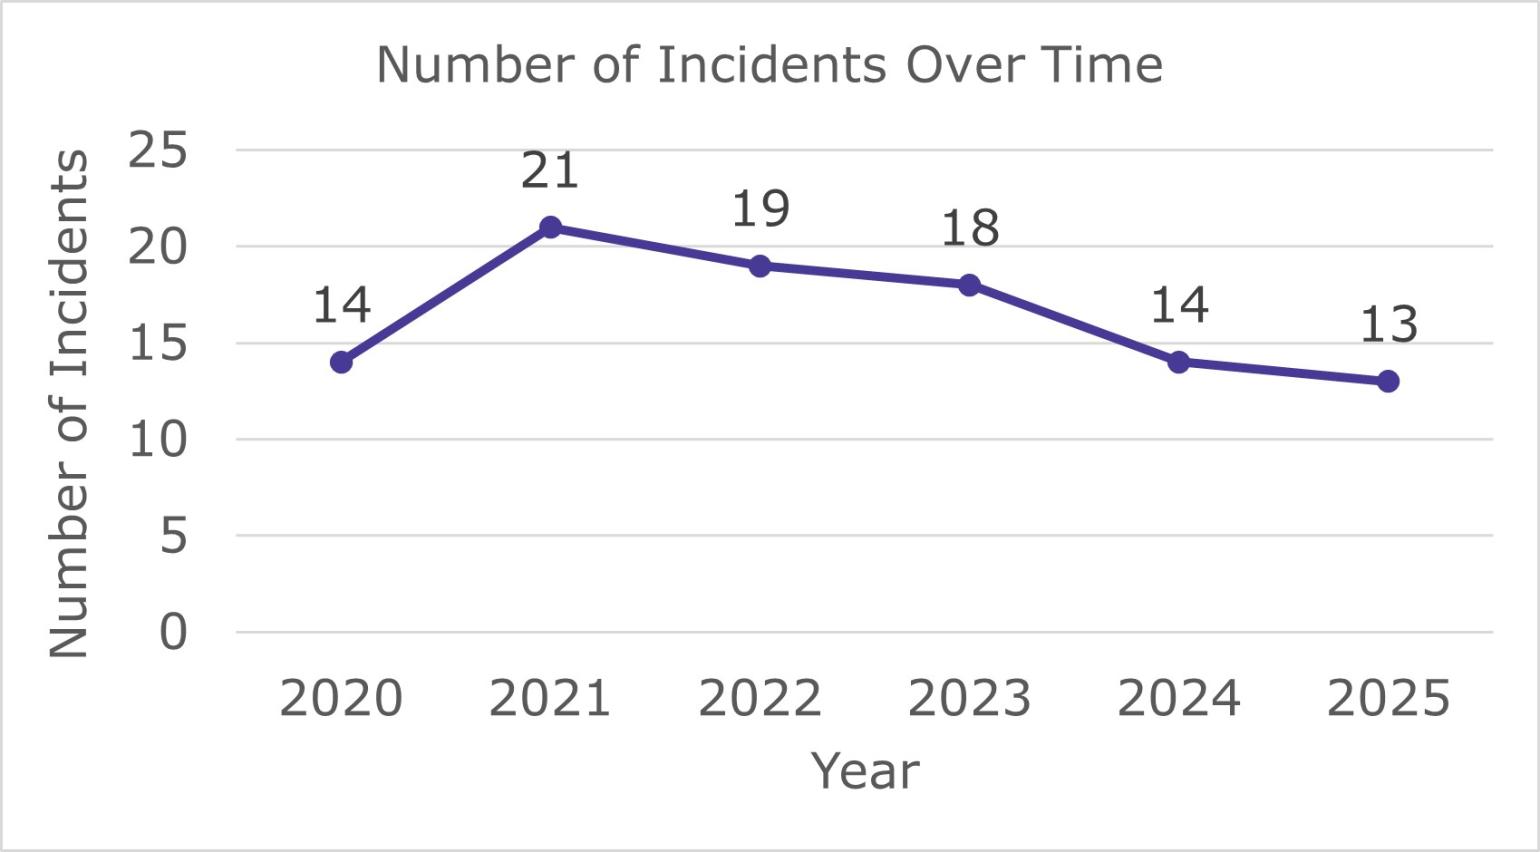
A yearly analysis of mass violence during the 6-year period reveals that incidents reached a peak in 2021 with 21 recorded incidents, followed by a steady, year-over-year decline through 2025 when there were 13 reported incidents. Notably, firearm-related incidents also peaked in North Carolina in 2021.3
Victim Demographic Information
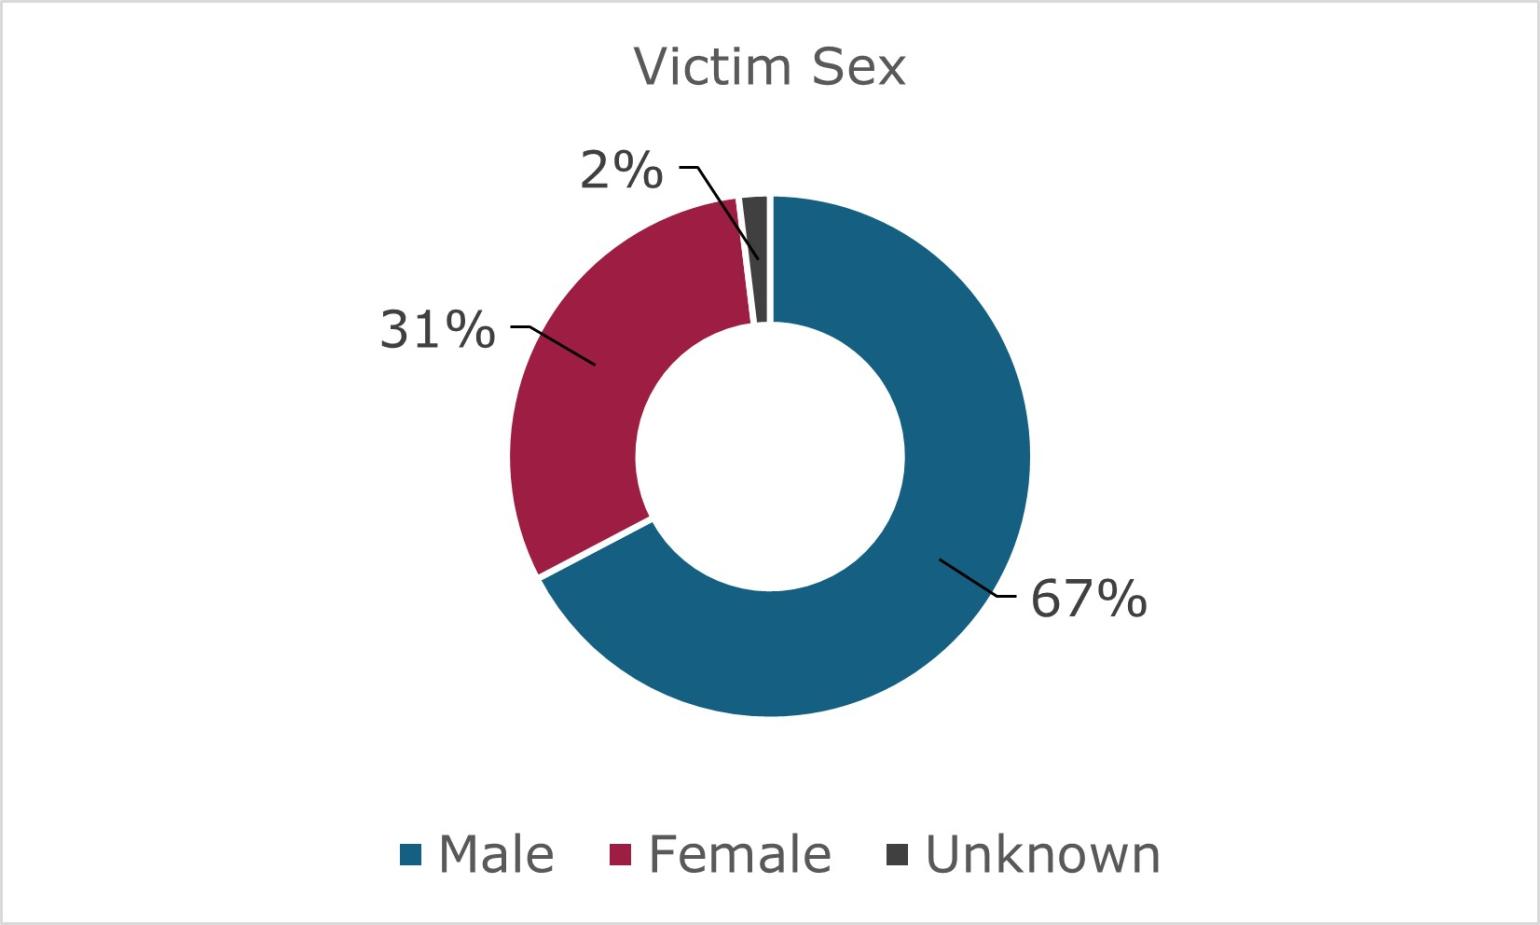
There were 315 male victims, 144 female victims and 9 victims whose sex was unknown.
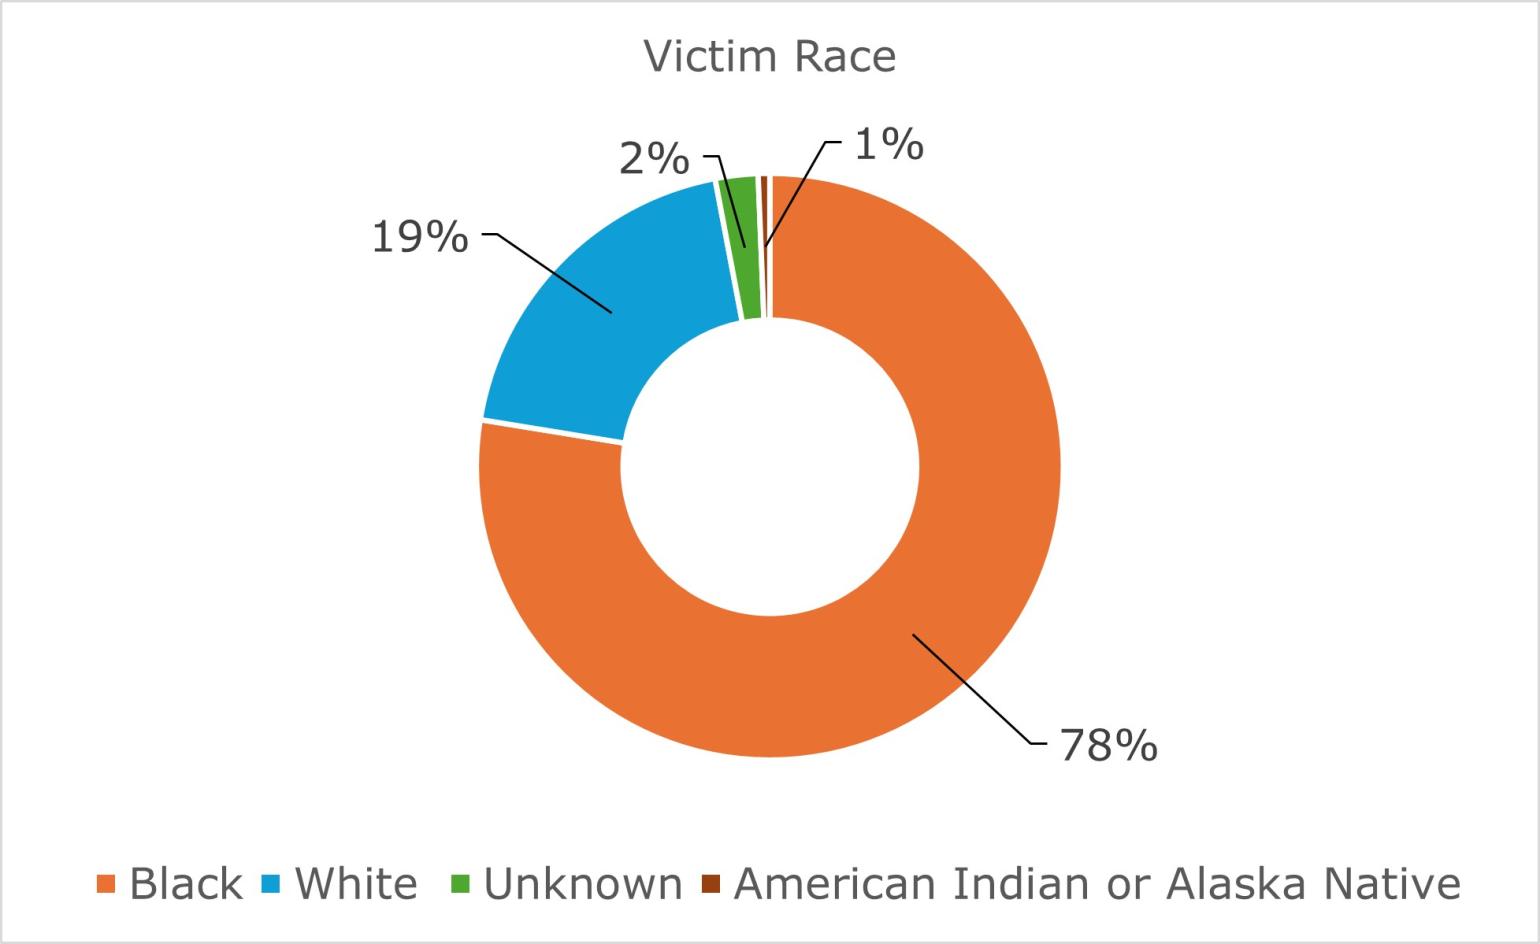
By race, victims included 363 Black individuals; 91 white individuals; 3 American Indian or Alaska Native individuals; and 11 individuals of unknown race.
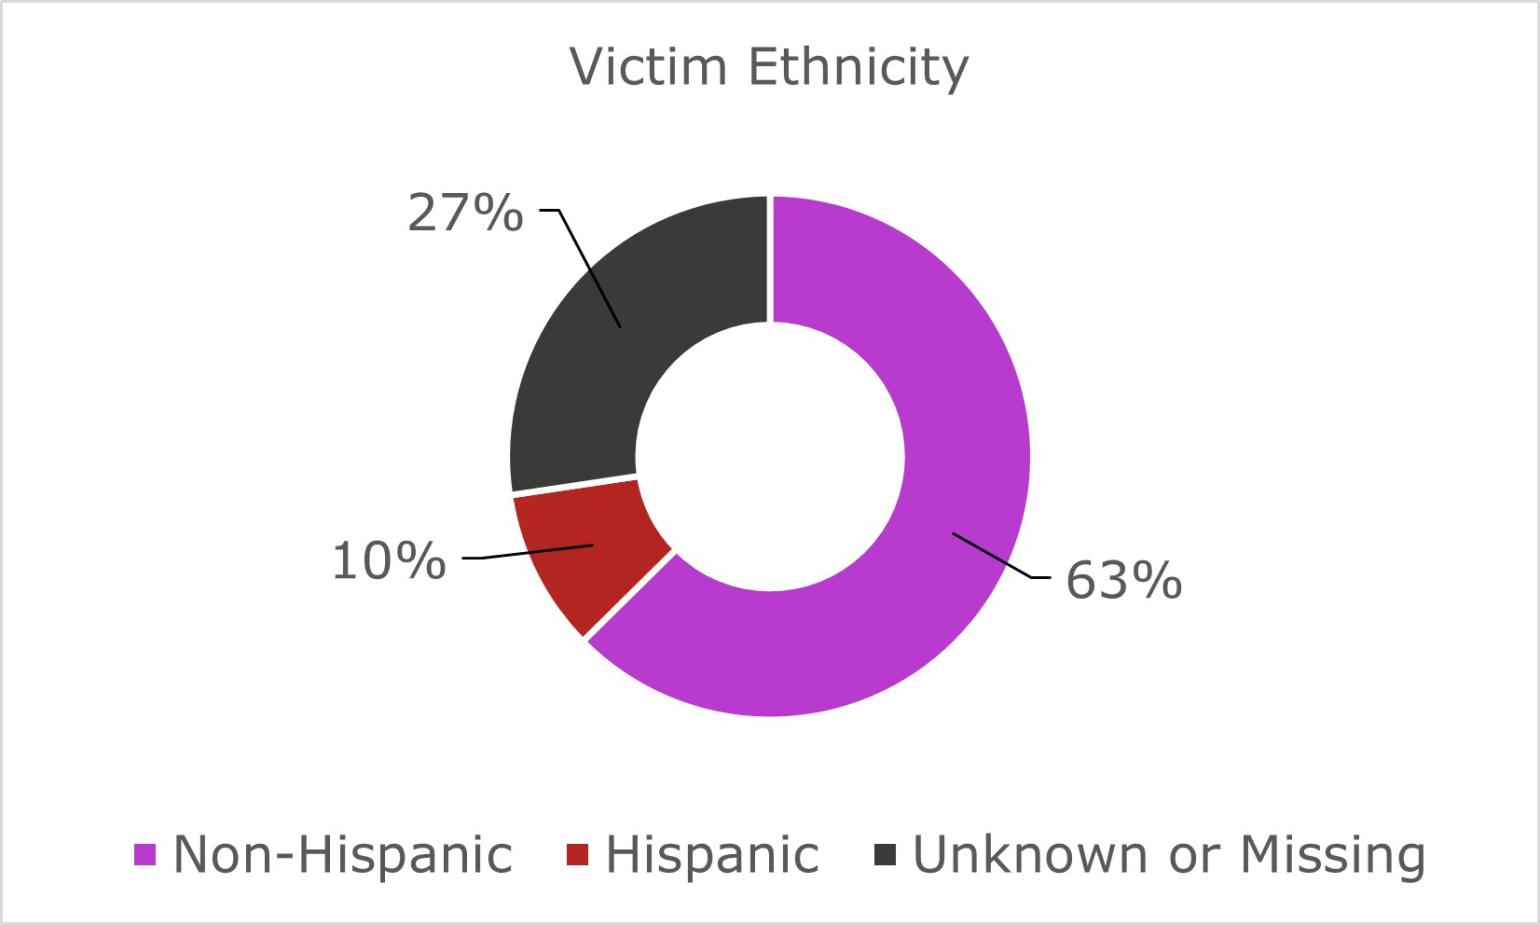
Examining ethnicity, there were 293 non-Hispanic victims and 47 Hispanic victims. NIBRS did not have ethnicity information for 128 victims.
The average age of victims was 27 years old. The oldest victim was 70 years old, and the youngest victim was one year old.
Location
Urban areas had more mass violence incidents compared to rural or suburban areas. Mass violence incidents in urban areas made up 62% of all mass violence incidents in North Carolina, while rural and suburban areas experienced less than 20% of incidents each.
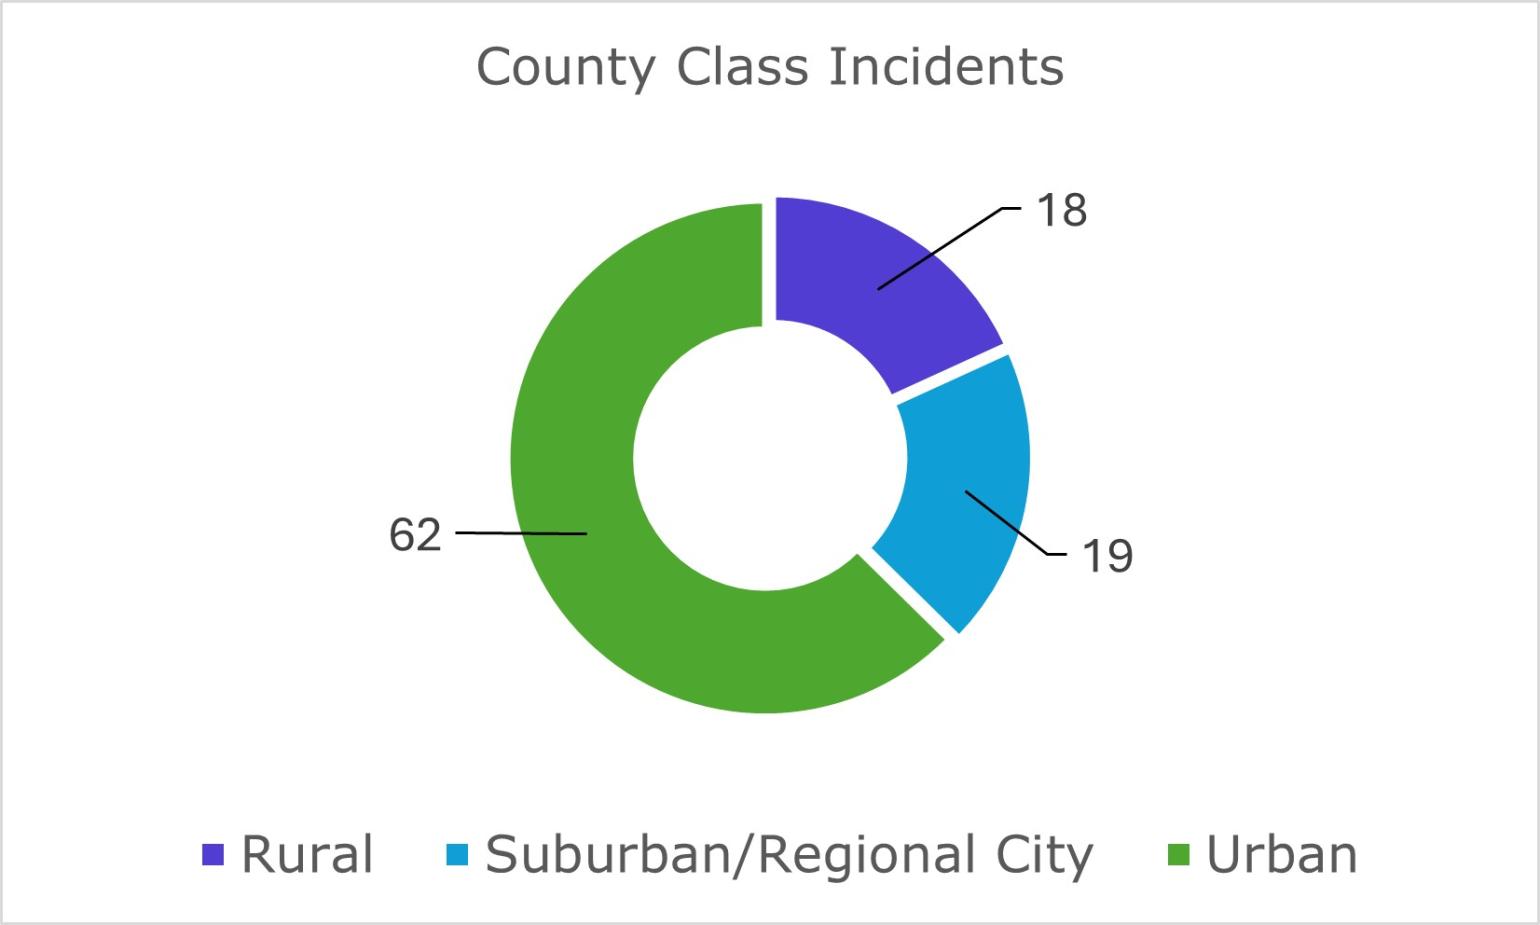
Mecklenburg, Durham and Wake counties had ten to 20 mass violence incidents between 2020 and 2025. Please use the dropdown menu to access more detailed county information.
Table View: County Class Incidents
| County | Number of Incidents | Percent of Total Incidents |
|---|---|---|
| Alamance | 3 | 3.03 |
| Bladen | 1 | 1.01 |
| Brunswick | 1 | 1.01 |
| Buncombe | 1 | 1.01 |
| Cabarrus | 1 | 1.01 |
| Cumberland | 6 | 6.06 |
| Davidson | 1 | 1.01 |
| Durham | 14 | 14.14 |
| Edgecombe | 1 | 1.01 |
| Forsyth | 8 | 8.08 |
| Gaston | 3 | 3.03 |
| Granville | 1 | 1.01 |
| Guilford | 8 | 8.08 |
| Halifax | 1 | 1.01 |
| Hertford | 1 | 1.01 |
| Johnston | 1 | 1.01 |
| Martin | 1 | 1.01 |
| Mecklenburg | 19 | 19.19 |
| Moore | 1 | 1.01 |
| Nash | 2 | 2.02 |
| New Hanover | 2 | 2.02 |
| Pasquotank | 3 | 3.03 |
| Person | 1 | 1.01 |
| Pitt | 3 | 3/03 |
| Robeson | 1 | 1.01 |
| Wake | 11 | 11.11 |
| Wayne | 1 | 1.01 |
| Wilson | 2 | 2.02 |
| Total | 99 | 99.99 |
Offender and Arrestee Information
In NIBRS, offender demographics are reported to law enforcement and may not reflect how a person may identify themselves. Offenders are not necessarily arrested.
There were 188 offenders reported with mass violence incidents. Of the recorded offenders, 132 were male and 14 were female. The remaining 42 were classified as unknown or had missing data.
By race, 118 offenders were reported as Black; 27 individuals were reported as white; 1 was reported as American Indian or Alaska Native; and 42 individuals did not have race data in NIBRS4.
According to NIBRS data, at least 60 individuals have been arrested in connection with 31 of the incidents. The arrested individuals had an average age of 25 and ranged from 16 to 48 years old. Demographically, 57 arrestees were Black, and three were white. Forty-nine were non-Hispanic, three were Hispanic, and eight had unknown or missing ethnicity data. The current arrest figures may be underreported due to data entry lags in the NIBRS database, variations in agency policy for data entry of case developments and contents of data submission to the State Bureau of Investigation. Additional outcomes reported include two offenders who died before they could be arrested, two whose prosecution was declined and one who is currently being held in another state or country. Finally, these data may not account for instances of offender suicide.
- 4
This report does not include ethnicity data for offenders due to the large amount of missing data in NIBRS.