White Collar Crime in North Carolina, 2020-2024
Published June 3, 2026, by Pom McCabe, research specialist at the Criminal Justice Analysis Center
Crime reporting often focuses on violent crimes like murder or assault, or on property crimes such as theft or burglary that involve taking property directly. However, white-collar crime can also have a devastating effect on its victims. In this report, we follow the FBI in defining white-collar crime by the offense committed. We present data on four types of property crimes that rely on trickery or coercion: fraud; counterfeiting or forgery; embezzlement; and extortion or blackmail. The data covers incidents reported by law enforcement from 2020 through 20241. In 2024, North Carolina law enforcement agencies recorded 47,013 incidents of fraud; 4,992 incidents of counterfeiting; 2,233 incidents of embezzlement; and 1,448 incidents of extortion.
- 1
Law enforcement agencies voluntarily report data to the State Bureau of Investigation via the National Incident-Based Reporting System (NIBRS). Agencies that report via NIBRS covered over 96% of the state population between 2020 and 2024.
Key Findings
- Reported incidents of fraud, embezzlement and extortion or blackmail increased, while counterfeiting decreased between 2020 and 2024. (Figure 1)
- Reported incidents of extortion in 2024 were more than double those in 2020. (Figure 1) There was a large increase in young male victims that peaked in 2023. (Figure 2)
- The rate of fraud against elderly victims has increased. (Figure 3)
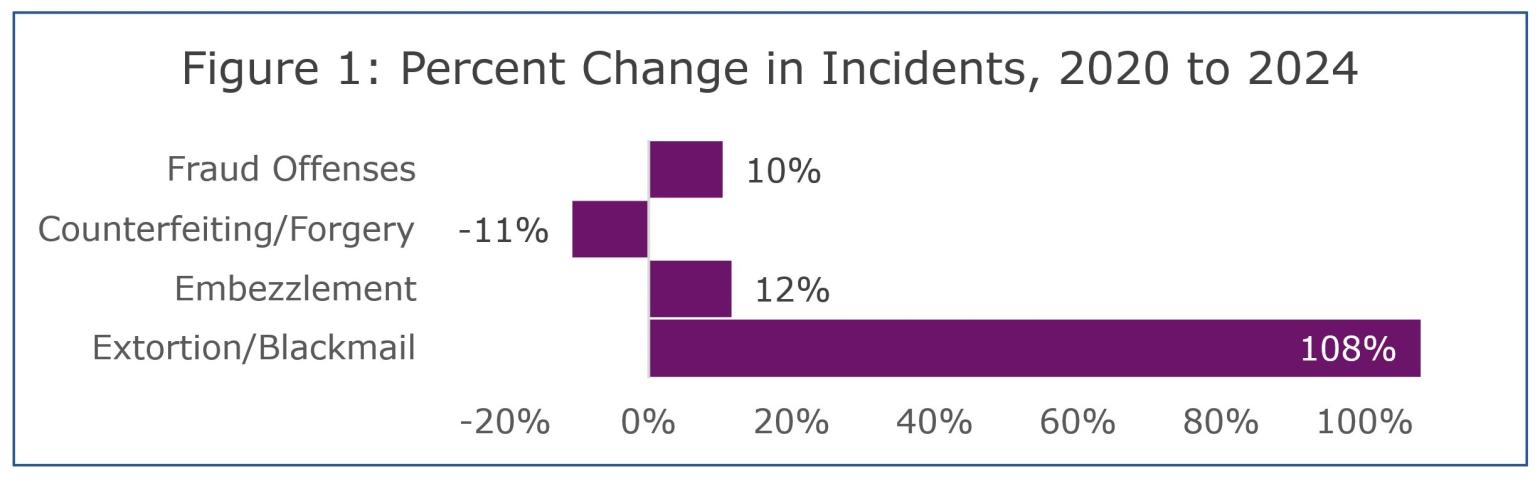
Table View: Figure 1
Figure 1: Percent Change in Incidents, 2020 to 2024
| Counterfeiting/Forgery | Embezzlement | Extortion/Blackmail | Fraud Offenses |
|---|---|---|---|
| -10.59% | 11.54% | 107.75% | 10.32% |
Between 2020 and 2024, the number of reported extortions increased by 108%. Fraud and embezzlement increased by about 10% each. Among these offenses, only counterfeiting declined.
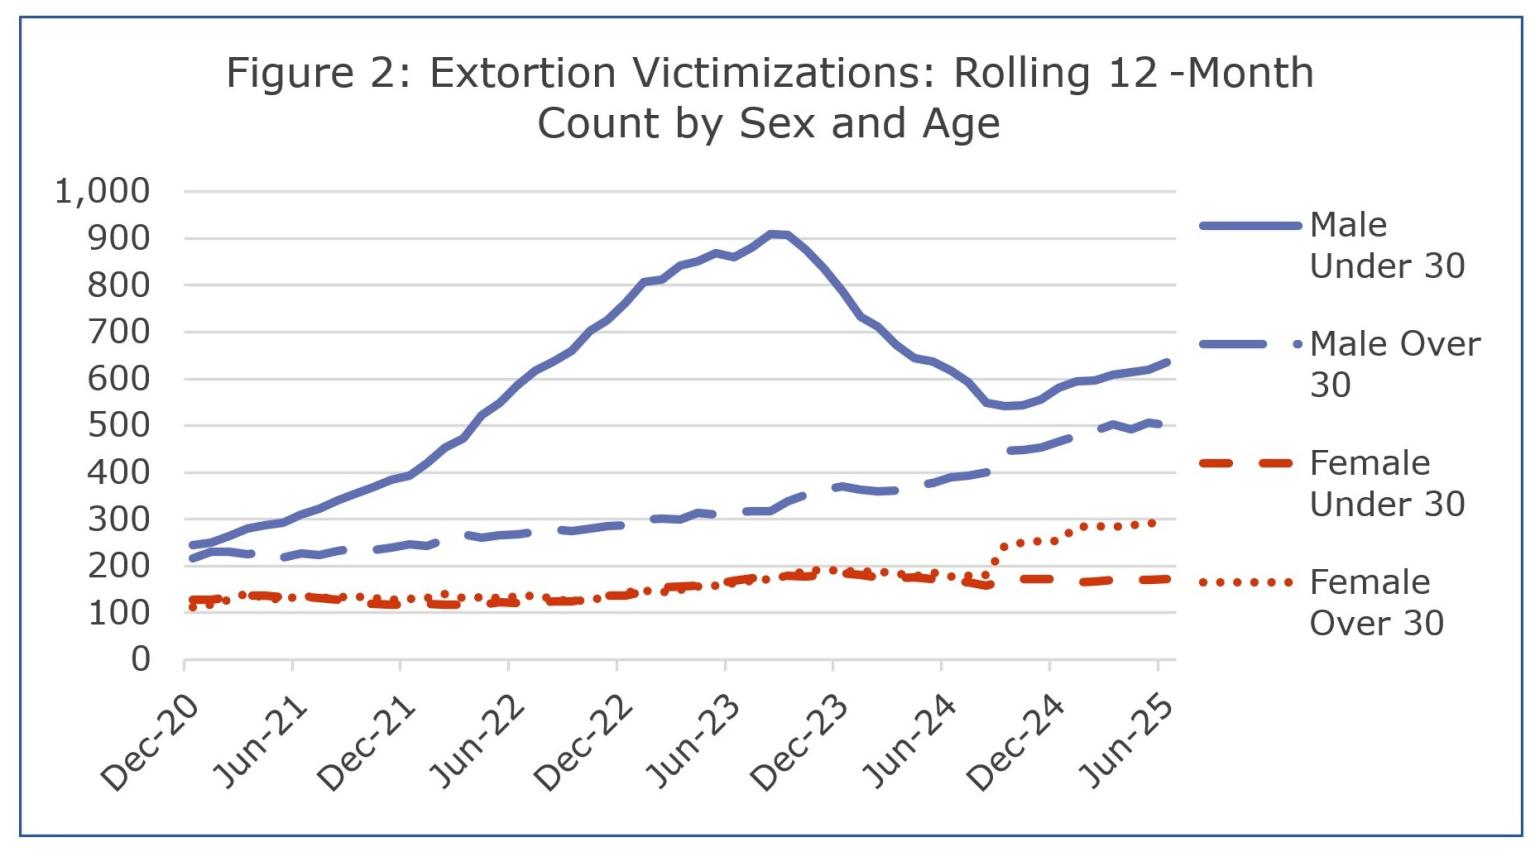
Table View: Figure 2
Figure 2: Extortion Victimizations: Rolling 12-Month Count by Sex and Age
| Month End | Male Under 30 | Male Over 30 | Female Under 30 | Female Over 30 |
|---|---|---|---|---|
| Dec-20 | 245 | 217 | 129 | 112 |
| Jan-21 | 251 | 230 | 129 | 118 |
| Feb-21 | 264 | 231 | 133 | 129 |
| Mar-21 | 281 | 226 | 137 | 143 |
| Apr-21 | 287 | 230 | 137 | 132 |
| May-21 | 292 | 219 | 134 | 129 |
| Jun-21 | 311 | 227 | 136 | 137 |
| Jul-21 | 322 | 223 | 131 | 131 |
| Aug-21 | 340 | 232 | 128 | 134 |
| Sep-21 | 355 | 237 | 121 | 136 |
| Oct-21 | 369 | 234 | 119 | 131 |
| Nov-21 | 385 | 240 | 118 | 128 |
| Dec-21 | 393 | 246 | 118 | 130 |
| Jan-22 | 420 | 243 | 120 | 131 |
| Feb-22 | 453 | 257 | 118 | 130 |
| Mar-22 | 473 | 267 | 118 | 132 |
| Apr-22 | 522 | 261 | 118 | 133 |
| May-22 | 549 | 266 | 123 | 132 |
| Jun-22 | 586 | 267 | 121 | 135 |
| Jul-22 | 617 | 273 | 121 | 137 |
| Aug-22 | 637 | 279 | 124 | 130 |
| Sep-22 | 661 | 275 | 125 | 125 |
| Oct-22 | 702 | 281 | 131 | 128 |
| Nov-22 | 726 | 286 | 137 | 134 |
| Dec-22 | 763 | 287 | 137 | 145 |
| Jan-23 | 806 | 300 | 146 | 148 |
| Feb-23 | 812 | 302 | 155 | 144 |
| Mar-23 | 843 | 300 | 156 | 150 |
| Apr-23 | 851 | 313 | 159 | 156 |
| May-23 | 869 | 311 | 132 | 158 |
| Jun-23 | 860 | 316 | 169 | 164 |
| Jul-23 | 881 | 318 | 175 | 169 |
| Aug-23 | 909 | 318 | 180 | 173 |
| Sep-23 | 907 | 339 | 180 | 173 |
| Oct-23 | 875 | 353 | 178 | 190 |
| Nov-23 | 835 | 363 | 181 | 191 |
| Dec-23 | 787 | 371 | 184 | 190 |
| Jan-24 | 733 | 364 | 181 | 188 |
| Feb-24 | 712 | 360 | 176 | 189 |
| Mar-24 | 673 | 361 | 175 | 185 |
| Apr-24 | 645 | 372 | 176 | 178 |
| May-24 | 638 | 377 | 173 | 187 |
| Jun-24 | 618 | 389 | 169 | 177 |
| Jul-24 | 593 | 393 | 165 | 180 |
| Aug-24 | 548 | 400 | 159 | 181 |
| Sep-24 | 542 | 447 | 171 | 244 |
| Oct-24 | 544 | 448 | 172 | 250 |
| Nov-24 | 555 | 454 | 172 | 253 |
| Dec-24 | 581 | 466 | 172 | 254 |
| Jan-25 | 595 | 479 | 166 | 283 |
| Feb-25 | 596 | 488 | 167 | 285 |
| Mar-25 | 608 | 503 | 170 | 284 |
| Apr-25 | 614 | 493 | 170 | 287 |
| May-25 | 620 | 507 | 171 | 291 |
| Jun-25 | 635 | 501 | 173 | 297 |
This graph includes extortion incidents occurring through June 2025. Extortion, also known as blackmail, involves obtaining something of value from the victim by coercion. While younger males are the most often victimized, extortions have increased across demographic groups since 2020. Additionally, a large number of extortions were reported in September 2024, which can be seen on the graph as a step up in the two over-30 lines.
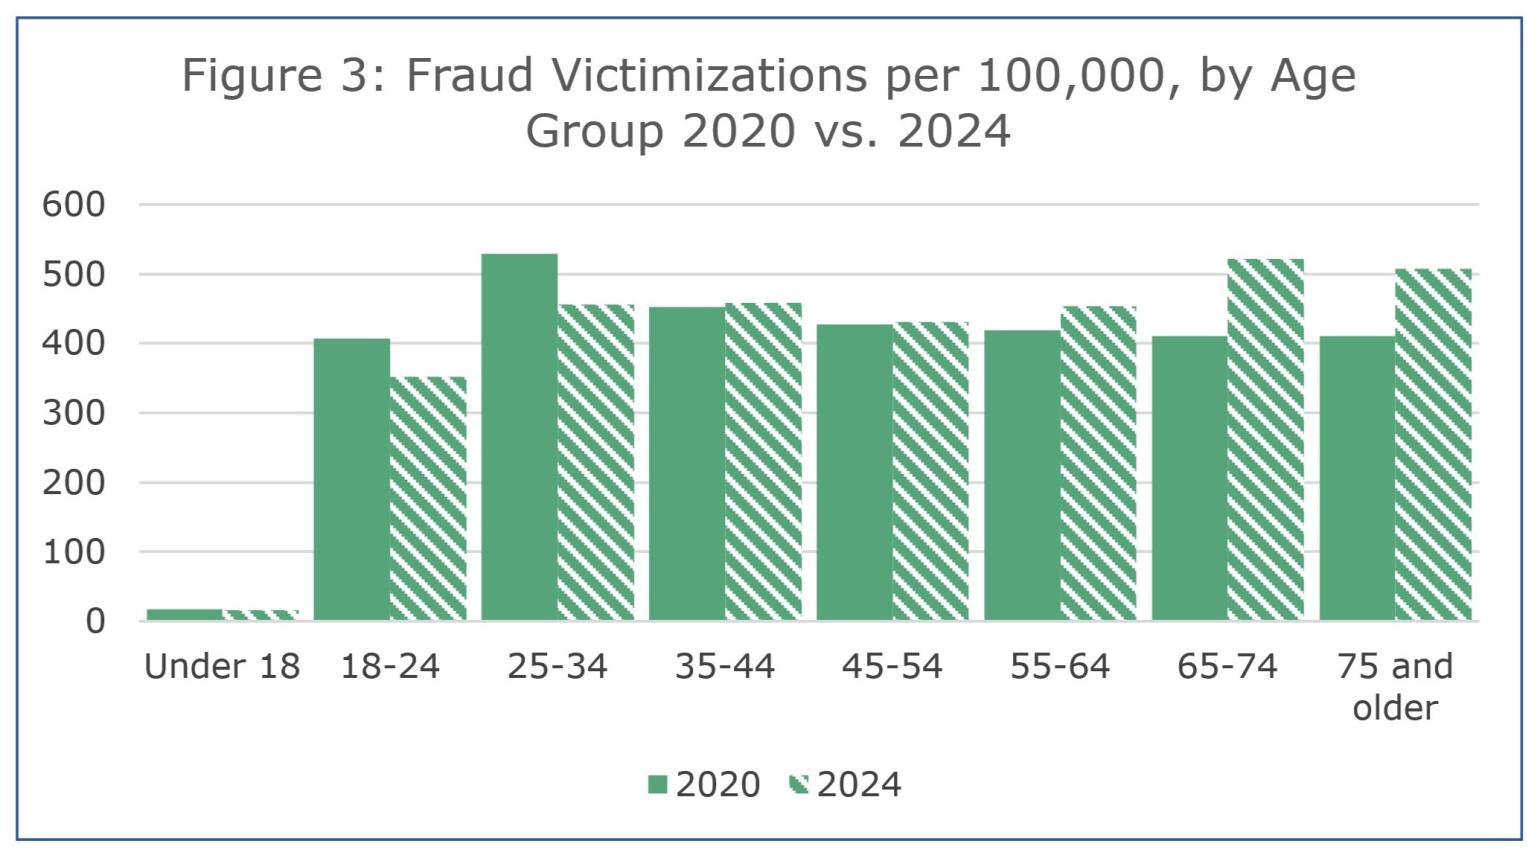
Table View: Figure 3
Figure 3: Fraud Victimizations per 100,000, by Age Group 2020 vs. 2024
| Year | Under 18 | 18-24 | 25-34 | 35-44 | 45-54 | 55-64 | 65-74 | 75 and older |
|---|---|---|---|---|---|---|---|---|
| 2020 | 17.35303 | 406.4259 | 528.9211 | 452.3188 | 426.7209 | 418.6857 | 410.8834 | 410.5701 |
| 2024 | 15.83807 | 352.0733 | 456.0331 | 457.9375 | 430.3375 | 454.0582 | 522.0879 | 507.4435 |
Fraud is the misrepresentation of the truth in order to obtain something of value. It is the most common type of white-collar crime. In 2020, the highest rate of reported fraud victimization was among adults aged 25 to 34. By 2024, ages 65 to 74 had the highest reported rate, followed by ages 75 and older.
While most white-collar offenses were committed on their own, in 2024:
- 30% of counterfeiting incidents also included fraud.
- 9% of incidents involving fraud also included theft.2
- When extortion victims were under 18, 10% of incidents also included pornography or obscene material offenses.
- 2
Including larceny offenses and motor vehicle theft.
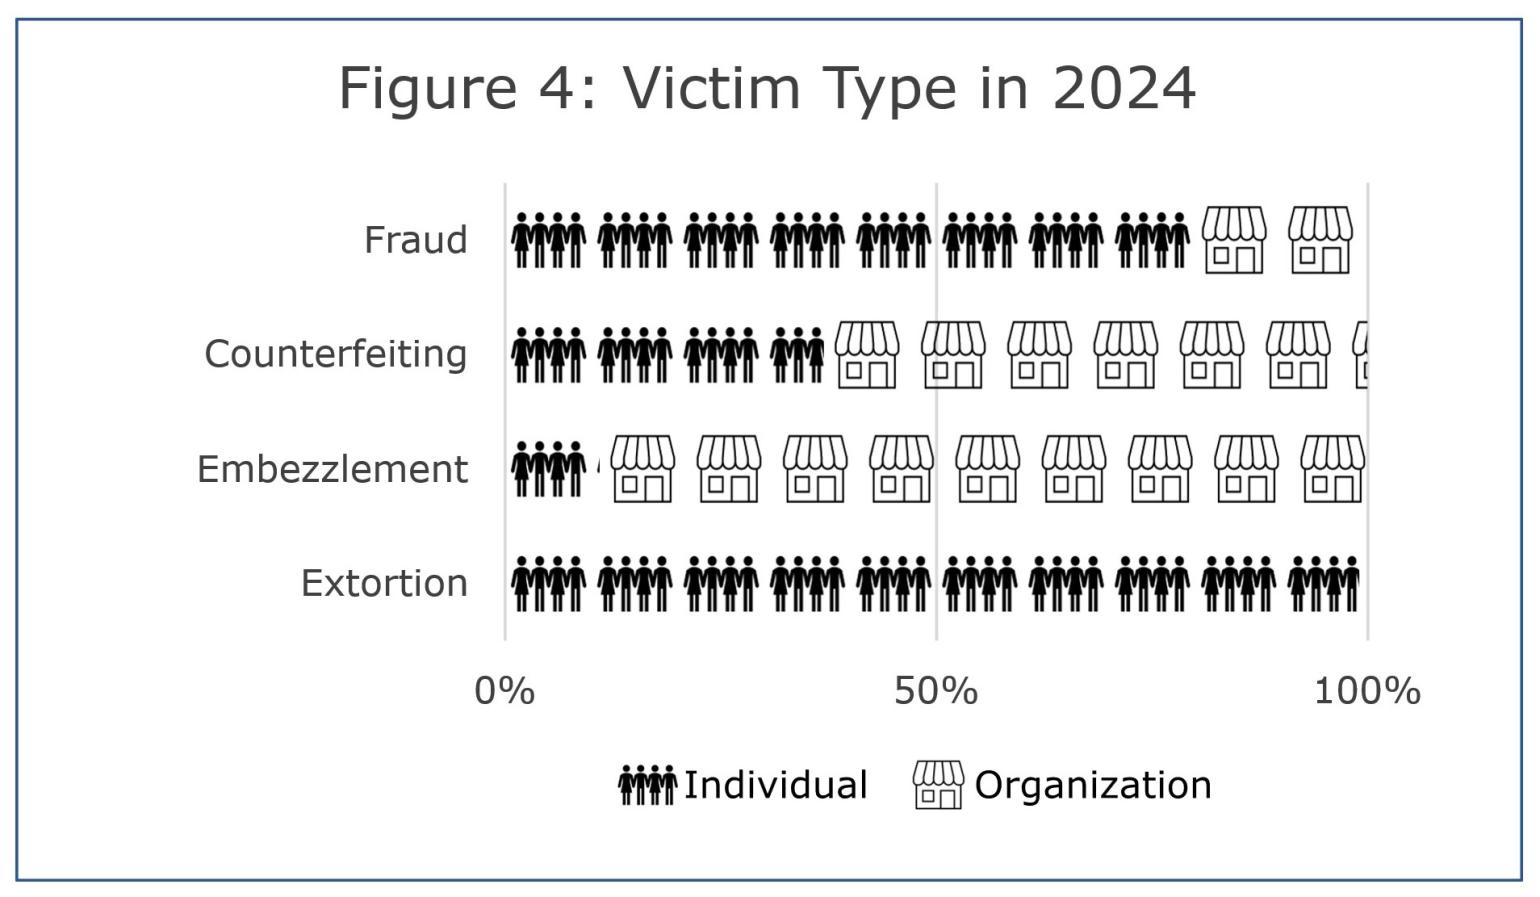
Table View: Figure 4
Figure 4: Victim Type in 2024
| Offense Type | Individual | Organization | Percent Individual | Percent Organization |
|---|---|---|---|---|
| Extortion | 1,486 | 14 | 99% | 1% |
| Embezzlement | 258 | 2,094 | 11% | 89% |
| Counterfeiting | 2,088 | 3,568 | 37% | 63% |
| Fraud | 40,230 | 10,355 | 80% | 20% |